The whiteboard is an infinite canvas for explaining things visually: flowcharts, diagrams, annotated screenshots, and publication-quality scientific figures with real charts, function plots, equations and lab and circuit symbols.
Your whiteboards
Click the branches icon in the bottom bar. The home screen shows every whiteboard as a thumbnail. Create a new one, open one, or use a card's menu to duplicate or delete it. Everything saves automatically.
A whiteboard can have several pages: they're the tabs along the bottom. + adds a page. Double-click a tab to rename it; its menu also duplicates, deletes or moves it left or right.
Moving around
- Pan: two-finger scroll on a trackpad, or scroll the mouse wheel.
- Zoom: pinch on a trackpad, Ctrl+scroll, or the zoom buttons. Fit to content shows everything on the page.
- Grid: show or hide it. Snap to grid lines things up as you drag; hold Alt to move freely while snapping is on (or to snap while it's off).
Tools
| Tool | What it does |
|---|---|
| Select | Click to select, drag a box to select several, Ctrl+A to select everything |
| Shapes | The shape library (see below) |
| Text | A text box |
| Equation (LaTeX) | Typeset maths. Type LaTeX, such as E = mc^2 or \frac{a}{b}, and it renders as you type |
| Insert image | A picture from your computer; you can also paste one with Ctrl+V |
| Pen | Freehand ink |
| Laser pointer | A glowing trail that fades; for pointing while you present or record. It leaves nothing behind |
| Arrows | Connectors (see below) |
The shape library
Shapes are grouped:
- Basic and General: rectangles, rounded boxes, ellipses, diamonds, polygons, stars, clouds, callouts, notes, steps, cylinders, cubes, tables, and flowchart symbols (document, predefined process, manual input, internal storage, display).
- Maths: plus, minus, multiply, divide, equals and comparison signs; axes, angles, vector arrows, the unit circle, number lines.
- Waveforms: sine, cosine, square, triangle and sawtooth waves.
- Science: circuit symbols (resistor, capacitor, battery, diode, inductor, ground, amplifier, spring/coil), lab glassware (flask, beaker), and chemistry (benzene ring, bond-line chains).
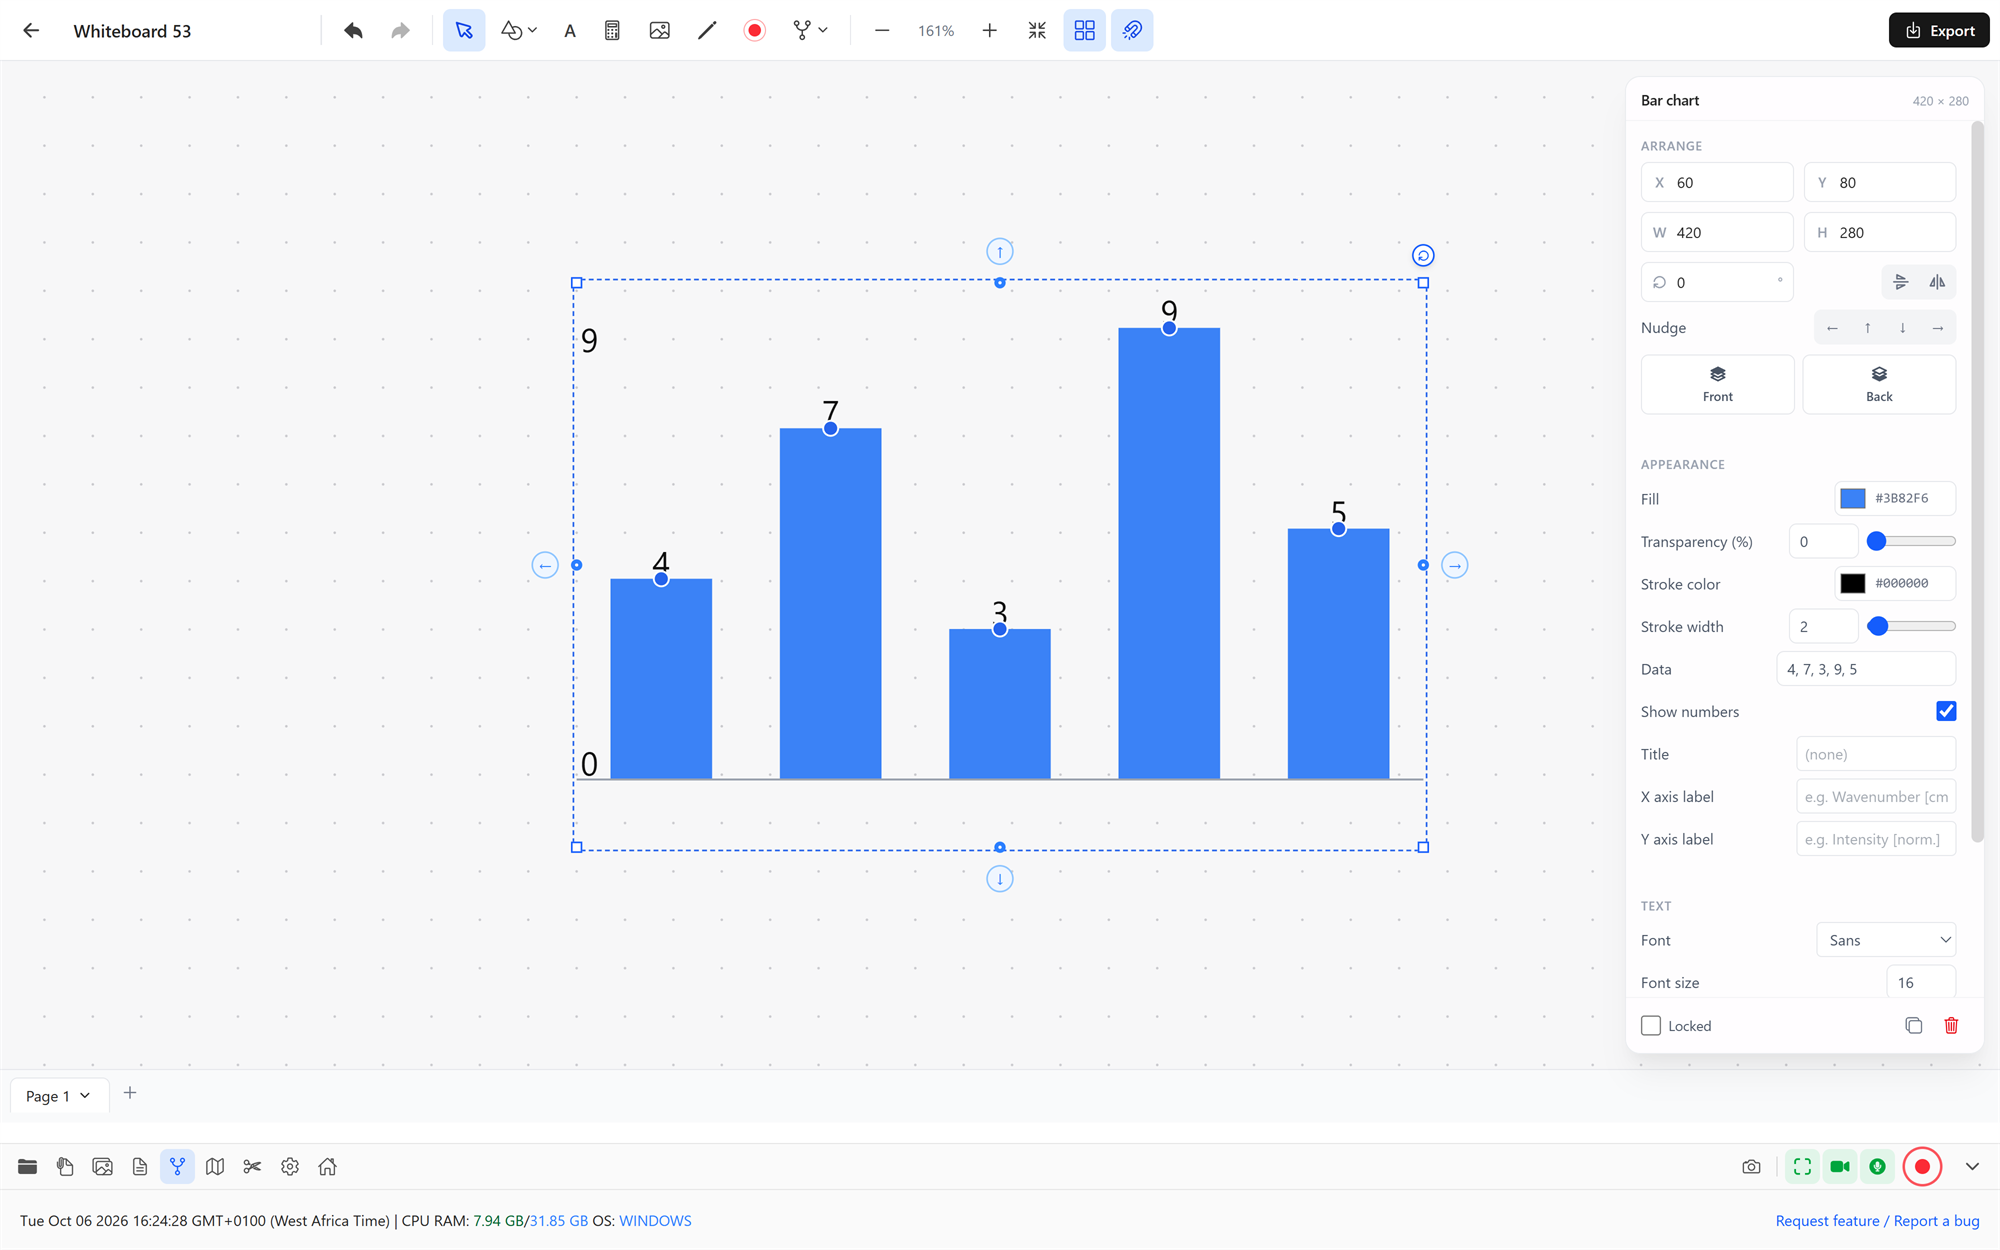
- Charts & Plots: bar, line and pie charts; scatter plots; blank graphs; function plots (linear, quadratic, cubic, sine, cosine, exponential, square root, logarithm, absolute value) and the normal distribution.
- Multi-series: waterfall/stacked spectra, overlaid series, ridgelines and separated traces, for comparing several measurements.
- Annotation: highlight frames, panel boxes, circle highlights, marker dots and labelled arrows for marking up figures.
- Physics 3D: an interactive lattice gauge theory model. Drag to orbit, scroll to zoom, and right-drag to pan.
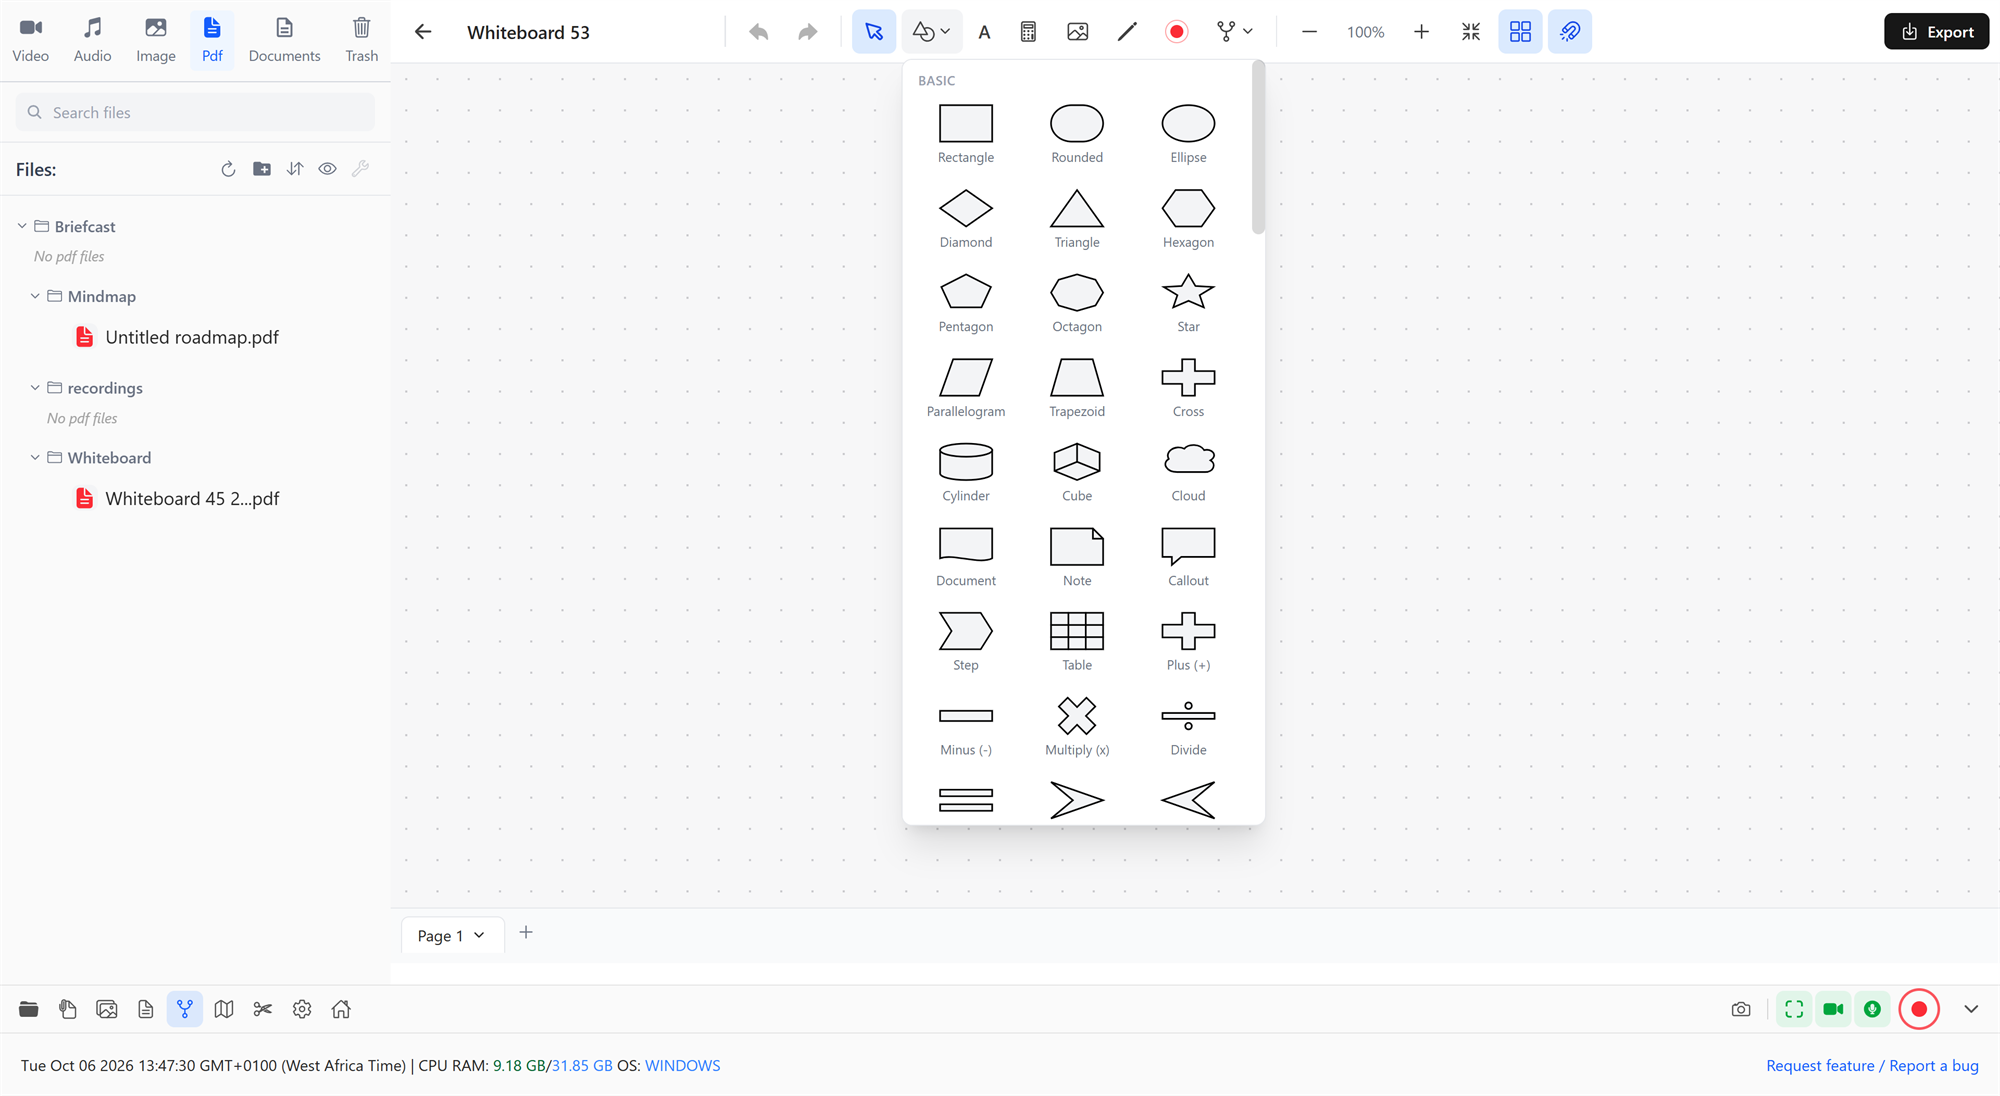
Choose a shape, then drag on the canvas to draw it at the size you want (or click to drop it at its default size). Move and resize it afterwards like anything else. Charts take their own data (type your values), and function plots let you set the zoom, cycles, tick spacing and grid.
Connectors
Arrows offers straight, bidirectional, orthogonal (right-angled) and curved connectors, plus open and block arrows, plain, dashed and dotted lines, and a freehand arrow. Drag from one shape to another and the connector attaches. Move the shapes, and it follows. Double-click a connector to add a bend point, and drag bend points to reshape it. Click a connector to change its colour, width, line style, routing, arrowheads or label.
Styling: the right panel
Select anything to open the panel on the right. Everything scrolls in one column:
Arrange
- Position (X, Y) and size (W, H).
- Rotation and flip.
- Nudge one pixel at a time (hold Shift for 10). The arrow keys do the same on the canvas.
- Front / Back, and Group / Ungroup when several things are selected. Grouped items move together.
- With several shapes selected, Layout aligns and arranges them as a figure.
Style
- Fill colour and Transparency: 0% is solid, 100% fully see-through. Only the fill fades, so a shape can sit over the image or plot it marks up without hiding it.
- Stroke colour and stroke width.
- Shape-specific options: corner radius, number of sides or points, wave cycles, chart data, and so on.
Text
- Font, size and colour; bold, italic, underline; horizontal and vertical alignment.
The footer holds Locked, which stops a shape from being moved or resized by accident, plus Duplicate and Delete.
Delete or Backspace removes what's selected; Ctrl+Z and Ctrl+Y undo and redo. Ctrl+C and Ctrl+V copy and paste shapes, and Ctrl+V also pastes an image from the clipboard, such as a screenshot you just took.
Tables
The Table shape is a real table: click a cell to type, choose the number of rows and columns in the panel, and hover a row or column to insert or delete one there. Select a range of cells to colour them.
Exporting
Export saves the current page as PNG or PDF:
- Save to library puts it in your Briefcast folder's
Whiteboardfolder. - Save as… lets you choose where.
Exports are rendered at high resolution, with equations, charts and the 3D model included, ready for slides or papers.